Deploy a water monitoring service from scratch
Monitoring the health of water bodies stands as one of the classic applications of Earth observation. Understanding and maintaining water quality is essential for sustaining ecosystems, ensuring public health, and supporting various human activities.
In this step-by-step tutorial you will learn how to create and deploy from scratch a project to monitor water bodies, using all the power of SPAI, its library and its functionalities.
Starting with the SPAI library
Of course, SPAI has its own Python library 🐍.
The SPAI Python library is your all-in-one solution to develop your AI4EO applications effortlessly. Everything you need, from data access and processing to modules for creating APIs, user interfaces, AI models and more, the SPAI library streamlines the entire process. Thus, it is clear that the SPAI library is perfect to create and develop our project to monitor water quality, without having to worry about how to deploy it later. Focus on creating value, and SPAI handles the rest.
So, and without waiting any longer, let’s start by creating our SPAI project and get into that code! 🚀
If you want more information about the library, do not hesitate and visit the reference. And remember, you need to have SPAI installed to use the library.
Developing the project
Creating the project
The first thing we are going to do is create our water-monitoring project. This is our entry point.
spai init water-monitoringOnce the project is created, a new folder should be created with water-monitoring name. The project has the typical structure of a SPAI project.
/water-monitoring
 |- /scripts
     |- /my-script-1
        |- main.py
        |- requirements.txt
        |- .env
     |- /my-script-2
     |- ...
 |- /apis
     |- /my-api-1
        |- main.py
        |- requirements.txt
        |- .env
     |- /my-api-2
     |- ...
 |- /uis
     |- /my-ui-1
        |- main.py
        |- requirements.txt
        |- .env
     |- /my-ui-2
     |- ...
 |- /notebooks
     |- /my-notebook-1
        |- main.ipynb
        |- requirements.txt
        |- .env
     |- /my-notebook-2
     |- ...
  |- spai.config.yaml
  |- spai.vars.json
As we have already seen in previous sections, the scripts, apis, uis and notebooks folders are where you will write your code.
The spai.config.yaml file contains the configuration for the project, and the spai.vars.json defines the environment variables that the service needs to be able to execute, such as the areas of interest or the time interval.
We are going to customize and edit all of this later.
You can learn more about the project structure here.
Configuring the project
Now that we have our project created, we can begin. The first thing we have to think about is what we want to achieve with the project. It is clear that we want to monitor water quality, but first we must ask ourselves some questions. Where are we going to do it, and what body of water do we want to monitor? In what time interval? What parameters do we want to monitor? These are important questions to ask ourselves before starting.
Let’s define where and when this water monitoring service will take place. As a place we have chosen the Boadella Reservoir,
in Catalonia, Spain, and as dates we have decided between August 1 and 10, 2022. Now we can create our spai.vars.json and edit it, creating an AOI variable for the area of interest and a DATES variable for the time interval.
{
    "AOI": {
      "type": "FeatureCollection",
      "features": [
        {
          "type": "Feature",
          "properties": {},
          "geometry": {
            "coordinates": [
              [
                [
                  2.774895642986394,
                  42.312148546678316
                ],
                [
                  2.8463084456034267,
                  42.312148546678316
                ],
                [
                  2.8463084456034267,
                  42.378561921676976
                ],
                [
                  2.774895642986394,
                  42.378561921676976
                ],
                [
                  2.774895642986394,
                  42.312148546678316
                ]
              ]
            ],
            "type": "Polygon"
          }
        }
      ]
    },
    "DATES": [
        "2022-08-01",
        "2022-08-10"
    ]
}
Once we have defined the where and when, we are going to define the what. There are many classic indicators to monitor water quality that can be analyzed with Earth Observation, but for this specific use case, we are going to simply stay with the water surface.
🤫 Let’s tell a secret: the SPAI library already has a module capable of extracting a lot of indicators automatically. Isn’t that wonderful? Thus, we will simply have to call a function and voilà! We will have the analytics!
So far so good. Now that we have defined what we want to do, let’s think about how: what scripts do we need? What APIs? What UIs? What is that UI going to be like?
Let’s take as a reference the UI of the forest monitoring template from the previous tutorial. We are going to do something similar: a web map where we can visualize the results, a graph and a table, and where we can change between indicators and dates. As a starting point, we should think about the following:
- We need a script to download Sentinel-2 images.
- We need a script to process the images and extract the spectral indices and indicators from them.
- We need an API to serve the results, in table or graph format.
- We need an API to serve the visualization of the results.
- We need a UI to display the results.
Now that we are clear, we are going to edit our spai.config.yaml and to define there the services that our project will have.
project: water-quality   # name of the project
storage:
  - name: data   # name of the storage
    type: local   # local storage as an starting point
scripts:
  - name: downloader   # download the Sentinel-2 images
    run_every: "* * * * *"   # as example run every minute, but this can be changed as needed
    run_on_start: True   # of course, we need to run this on start
  - name: water-quality   # analyze the images and get the water quality indicators
    run_every: "* * * * *"   # same as before
    run_on_start: True   # same as before
apis:
  - name: analytics   # api to serve the result analytics
    port: 8021   # api port
    host: localhost   # localhost as an starting point
  - name: xyz   # api to serve the visualization
    port: 8022   # api port
    host: localhost   # localhost as an starting point
uis:
  - name: map   # the map UI
    command: streamlit run main.py --server.address localhost   # this is the command to run the streamlit UI
    port: 8501   # ui port
    env: # use api names as url placeholders
      ANALYTICS_URL: api.analytics
      XYZ_URL: api.xyz
What have we done here?
- We have defined the
storage, which is the storage entity where the data, results and analytics that we are going to obtain will be stored, and we have defined it as local. - We have defined the scripts, one to download images and another to process them, and we have defined that they be executed every minute as a demonstration and at the beginning of the execution.
- We have defined the APIs, one to serve analytics and another to serve visualization, along with their ports.
- We have defined the UI, which will be a streamlit application, with the command to deploy it.
And now that we’ve defined that, let’s rename our folder structure.
/water-monitoring
  |- /scripts
     |- /downloader
        |- main.py
        |- requirements.txt
        |- .env
     |- /water-quality
        |- main.py
        |- requirements.txt
  |- /apis
     |- /analytics
        |- main.py
        |- requirements.txt
     |- /xyz
        |- main.py
        |- requirements.txt
  |- /uis
     |- /map
        |- main.py
        |- requirements.txt
  |- spai.config.yaml
  |- spai.vars.json
Well, this is already taking shape. Now that we have defined our project, let’s code!
Remember that for each service within the project, such as scripts, APIs and others, you must add their corresponding dependencies in its
requirements.txt.
Key features
Let’s talk about some key concepts. In the spai.config.yaml we have already introduced the concept of Storage,
and in the spai.vars.json we have introduced the concept of environment variables.
Storage
The Storage is the entity where the data, results and analytics that we are going to obtain will be stored.
This ‘Storage’ can be local, on your computer, or in the cloud, in an S3 bucket. Obviously, it is fully accessible from the SPAI Python library.
The first thing we have to do is import it:
from spai.storage import StorageAnd now that we have it, we simply have to start it:
storage = Storage()With this line of code, the SPAI library reads the spai.config.yaml and obtains information about the Storage that we are using.
In the end, it is nothing more than a Python dictionary. So if we want to access our local storage, called data, it is as simple as:
storage = Storage()["data"]And with this, we have full access to our data. We could execute a multitude of functions, such as obtaining a list of the Sentinel-2 images that we
have in the Storage (if there are any) or even reading a csv as a DataFrame from Pandas:
images = storage.list("S2L2A*.tif")
df = storage.read("data.csv")
You can know more about the
Storagehere.
Variables
Variables can be accessed throughout the SPAI project in order to be executed and deployed. They can be a geometry, a list of dates, credentials or anything that you can define in the JSON file. The first thing we have to do is import the variables and init them:
from spai.config import SPAIVars vars = SPAIVars()
As in the case of storage, vars is simply a Python dictionary, so it is very easy to access the AOI and DATES that we have defined in the spai.config.yaml.
aoi = vars["AOI"]
dates = vars["DATES"]
And that’s it! With this we can manage global variables throughout our entire project. So easy 🚀
How many times has it happened to us that we need to manage one or many variables for a very large project, and that has become very difficult to maintain? Well, SPAI variables are the solution to that problem ✅
Scripts
Downloader
To download Sentinel-2 images in the area of interest and for the selected dates, the first thing we will have to do is define the Storage where
those images will be saved and the environment variables to know where and when they are from.
from spai.storage import Storage
from spai.config import SPAIVars

storage = Storage()["data"]
vars = SPAIVars()

aoi = vars["AOI"]   # the area of interest
dates = vars["DATES"]   # the dates
But now, how do we search and download the images? SPAI to the rescue! 🦸🏻
from spai.data.satellite import download_satellite_imagery, explore_satellite_imagery

images = explore_satellite_images(aoi, dates, cloud_cover=10)

print(f"Found {len(images)} images")
What we have done with three lines of code is import the functions to explore and download images,
search for them by aoi and dates and print on the screen how many we have found.
Let’s go ahead and download the images!
collection = "sentinel-2-l2a"   # Define the sensor to download, in this case Sentinel-2 L2A
for image in images:
  date = image["date"].split("T")[0]
  print("Downloading new image:", date)
  path = download_satellite_imagery(storage, aoi, date, collection)
  print("Image saved at", path)
And that’s it, we now have our images saved directly in our Storage! Now it is local, but imagine being able to download them directly to your S3 bucket 🤭
📦 Explore the
Storageto see what you’ve downloaded!
This code can of course be improved to add filters or whatever we need. Below we leave you what the complete downloader/main.py script would look like:
from dotenv import load_dotenv
from spai.data.satellite import download_satellite_imagery, explore_satellite_imagery
from spai.storage import Storage
from spai.config import SPAIVars

load_dotenv()

storage = Storage()["data"]
vars = SPAIVars()


if __name__ == "__main__":
    # explore available images
    print("Looking for images in the last month")
    aoi = vars["AOI"]
    dates = vars["DATES"]
    images = explore_satellite_images(aoi, dates, cloud_cover=10)

    if len(images) == 0:
        raise ValueError("No images found")

    # download images and save locally
    collection = "sentinel-2-l2a"
    print(f"Found {len(images)} images")
    for image in images:
        existing_images = storage.list(f"{sensor}*.tif")
        dates = [image.split("_")[1].split(".")[0] for image in existing_images]
        date = image["date"].split("T")[0]
        # check if image is already downloaded
        if date in dates or image in existing_images:
            continue
        print("Downloading new image:", date)
        path = download_satellite_imagery(storage, aoi, date, collection)
        print("Image saved at", path)
Water quality
Now that we have the images, let’s process them!
As we have seen before, what we want to extract is simply the water surface, that is, the water mask. This can be done in many ways, but wouldn’t it be awesome to have it in a single function? That with a single function call, you could retrieve the water mask, without worrying about anything else? Again SPAI is to the rescue, because this is what it can do!
In SPAI we find analytical building blocks ready to be used to extract analytics from a satellite image, in one fell swoop. And precisely, at SPAI we can find a building block for water quality. Very convenient 😜
from spai.analytics.water_quality import water_qualityAnd now that we have imported the water quality analytical building block, we can apply it to the images in our Storage!
from spai.storage import Storage
from spai.config import SPAIVars

storage = Storage()["data"]
vars = SPAIVars()

images = storage.list(f"S2L2A*.tif")
aoi = vars["AOI"]
for image in images:
    water_quality(image, aoi, storage)
With just a couple of lines of code we have processed the images and obtained various analytics from them, including the water mask.
🤐 Second secret! The water quality analytical building block extracts many more analytics than just the water mask. We encourage you to try it and explore for yourself what they are! Check the reference to know more.
As before, we leave you the entire code of water-quality/main.py.
from spai.analytics.water_quality import water_quality
from spai.storage import Storage
from spai.config import SPAIVars
from tqdm import tqdm
from dotenv import load_dotenv

load_dotenv()

storage = Storage()["data"]
vars = SPAIVars()


if __name__ == "__main__":
    sensor = "S2L2A"  # or 'S2L1C'
    images = storage.list(f"{sensor}*.tif")
    aoi = vars["AOI"]
    for image in tqdm(images, desc="Processing images..."):
        water_quality(image, aoi, storage)
APIs
analytics
As a result of the water quality pulse, a set of analytics and files have been generated,
some of them in json format that will allow us to obtain information about the temporal evolution
of the water mask. We need these analytics to serve in some way to be able to see them from the ui,
so we are going to deploy an API that does just this.
To do this, and for this specific tutorial, we are going to use Python libraries such as fastapi, uvicorn or pandas,
and we are going to define a function that returns the requested analytics file in DataFrame format.
As this part is not very focused on SPAI, we leave you the complete code of analytics/main.py.
import argparse

import uvicorn
import pandas as pd
from fastapi import FastAPI, HTTPException
from fastapi.middleware.cors import CORSMiddleware
from spai.storage import Storage

app = FastAPI(title="analytics")
app.add_middleware(
    CORSMiddleware,
    allow_origins=["*"],
    allow_credentials=True,
    allow_methods=["*"],
    allow_headers=["*"],
)

storage = Storage()["data"]


@app.get("/{analytics_file}")
async def analytics(analytics_file: str):
    try:
        analytics = storage.read(f"{analytics_file}.json")
        # Format date to ensure it is in the correct format
        if isinstance(analytics.index, pd.DatetimeIndex):
            analytics.index = analytics.index.strftime("%Y-%m-%d")
        analytics = analytics.to_dict()
        return analytics
    except Exception as e:
        raise HTTPException(status_code=500, detail=str(e))


# need this to run in background
if __name__ == "__main__":
    parser = argparse.ArgumentParser()
    parser.add_argument("--host", type=str, default="0.0.0.0")
    parser.add_argument("--port", type=int, default=8000)
    args = parser.parse_args()
    uvicorn.run(app, host=args.host, port=args.port)
xyz
On the other hand, we also need an API to be able to display the water masks in the webmap that we
are going to integrate into our ui. To do this, we are going to deploy a xyz tile server, and as always,
SPAI helps us make this easier.
from spai.image.xyz import get_image_data, get_tile_data, ready_image
from spai.image.xyz.errors import ImageOutOfBounds
from spai.storage import Storage
With this, we have imported different functions to obtain and generate tiles from a tif image that we have in our Storage.
If you follow the code we leave you below for xyz/main.py, you can build your own xyz tile server!
from typing import Optional
import argparse

import uvicorn
from fastapi import FastAPI, HTTPException, status
from fastapi.middleware.cors import CORSMiddleware
from spai.image.xyz import get_image_data, get_tile_data, ready_image
from spai.image.xyz.errors import ImageOutOfBounds
from spai.storage import Storage
from starlette.responses import StreamingResponse

# init api
app = FastAPI(title="xyz")

# configure CORS
origins = [
    "*",
]

app.add_middleware(
    CORSMiddleware,
    allow_origins=origins,
    allow_credentials=True,
    allow_methods=["*"],
    allow_headers=["*"],
)

storage = Storage()["data"]


@app.get("/")
def retrieve_images():
    return storage.list("*.tif")


@app.get("/{image}/{z}/{x}/{y}.png")
def retrieve_image_tile(
    image: str,
    z: int,
    x: int,
    y: int,
    bands: Optional[str] = "1",
    stretch: Optional[str] = "0,1",
    palette: Optional[str] = "viridis",
):
    image_path = storage.get_path(image)
    tile_size = (256, 256)
    if len(bands) == 1:
        bands = int(bands)
    else:
        bands = tuple([int(band) for band in bands.split(",")])
    stretch = tuple([float(v) for v in stretch.split(",")])
    try:
        tile = get_tile_data(image_path, (x, y, z), bands, tile_size)
        tile = get_image_data(tile, stretch, palette)
        image = ready_image(tile)
        return StreamingResponse(image, media_type="image/png")
    except ImageOutOfBounds as error:
        raise HTTPException(status_code=status.HTTP_404_NOT_FOUND, detail=error.message)


# need this to run in background
if __name__ == "__main__":
    parser = argparse.ArgumentParser()
    parser.add_argument("--host", type=str, default="0.0.0.0")
    parser.add_argument("--port", type=int, default=8080)
    args = parser.parse_args()
    uvicorn.run(app, host=args.host, port=args.port)
UI
map
We’re almost there! For the ui, we are going to develop a streamlit application, which will allow us to display a ui to view the results quickly.
We are also going to use other libraries that we have not used until now, such as folium for the webmap or geopandas.
🤯 Do you see how you can use a multitude of Python libraries and integrate different technologies in a SPAI project? Everything is Python, so everything is integrable!
For the ui, we are going to use different functions. First of all we will need a function to obtain the analytics from the analitcs api,
a function to be able to obtain the centroid of the aoi, and for the map to center there directly, and another to be able to comfortably
switch between dates and variables (if there were more!).
For this tutorial we have used streamlit, but you are totally free to use other technologies to display your
ui, such asnode.js. Just remember that you will have to edit the command in thespai.config.yaml. Feel free to explore!
import os

import folium
from streamlit_folium import folium_static
import geopandas as gpd
import pandas as pd
import requests
import streamlit as st
from spai.config import SPAIVars

vars = SPAIVars()

ANALYTICS_URL = 'http://' + os.getenv("ANALYTICS_URL")
XYZ_URL = 'http://' + os.getenv("XYZ_URL")


@st.cache_data(ttl=10)
def get_data(analytics_file: str):
    api_url = os.getenv("ANALYTICS_URL")
    analytics = requests.get(f"{api_url}/{analytics_file}", timeout=10).json()
    analytics_df = pd.DataFrame(analytics)
    analytics_df.sort_index(inplace=True)
    return analytics_df


def get_aoi_centroid():
    aoi = vars["AOI"]
    gdf = gpd.GeoDataFrame.from_features(aoi)
    centroid = gdf.geometry.centroid[0].y, gdf.geometry.centroid[0].x

    return centroid


def choose_variables():
    base_df = get_data("table_water_extent")
    print(base_df)
    with st.sidebar:
        st.sidebar.markdown("### Select date and indicator")
        date = st.selectbox("Date", base_df.index)
        variable = st.selectbox("Indicator", ["Water extent"])
        analytics_file = "table_water_extent"
        df = get_data(analytics_file)
        # Drop unused columns from Water extent table
        if variable == "Water extent":
            df = df[["Water [Has]", "Not Water [Has]", "Percentage [%]"]]
    return date, variable, df
And now, all we have to do is create the streamlit application, with the folium map,
and integrate the data. We passed this part faster, since it is not so focused on the SPAI library.
st.set_page_config(page_title="Water quality monitoring Pulse", page_icon="💧")
centroid = get_aoi_centroid()
date, variable, dataframe = choose_variables()
# Create map with Folium
m = folium.Map(
location=centroid,
zoom_start=12,
tiles="CartoDB Positron",
)
# Add the analytic layer to the map
raster = folium.raster_layers.TileLayer(
tiles=f"http://{XYZ_URL}/median_water_mask_{date}.tif/{{z}}/{{x}}/{{y}}.png?palette=Blues&stretch=0,1",
attr="Water Quality Pulse",
name="Water",
overlay=True,
control=True,
show=True,
)
raster.add_to(m)
folium_static(m)
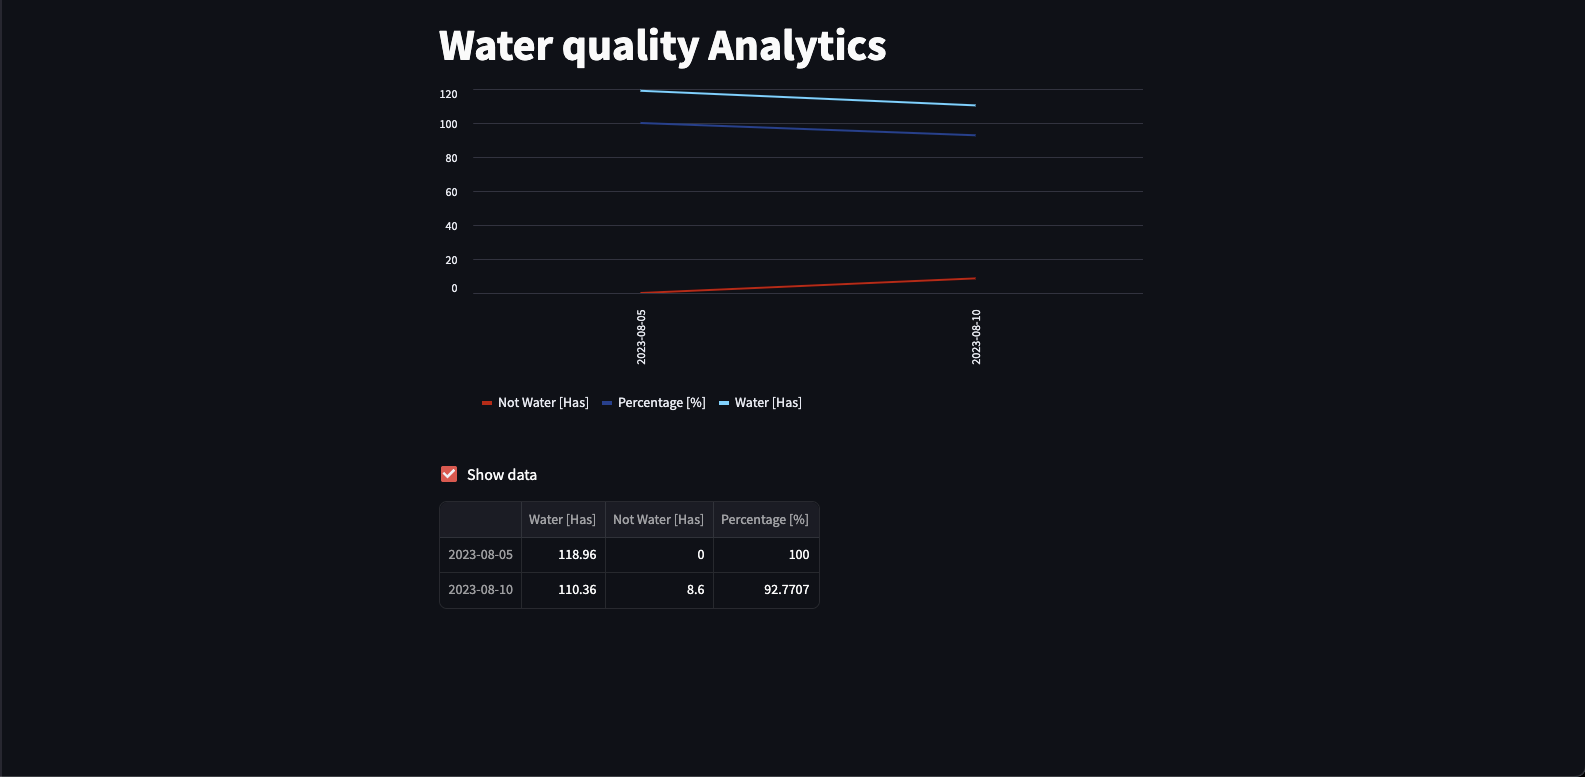
st.title("Water quality Analytics")
st.line_chart(dataframe, color=["#D80707", "#01438E", "#00D4FF"])
if st.checkbox("Show data"):
st.write(dataframe)And that’s all, folks! We have now created and finished our project to monitor the water surface of a body of water over time! But don’t go yet, the best part remains. Why would we want to have the project if we couldn’t deploy it and see the results? Well let’s go back to the CLI!
As in the previous cases, we leave you the complete code of map/main.py.
import os

import folium
from streamlit_folium import folium_static
import geopandas as gpd
import pandas as pd
import requests
import streamlit as st
from spai.config import SPAIVars

vars = SPAIVars()

ANALYTICS_URL = 'http://' + os.getenv("ANALYTICS_URL")
XYZ_URL = 'http://' + os.getenv("XYZ_URL")


@st.cache_data(ttl=10)
def get_data(analytics_file: str):
    api_url = os.getenv("ANALYTICS_URL")
    analytics = requests.get(f"{api_url}/{analytics_file}", timeout=10).json()
    analytics_df = pd.DataFrame(analytics)
    analytics_df.sort_index(inplace=True)
    return analytics_df


def get_aoi_centroid():
    aoi = vars["AOI"]
    gdf = gpd.GeoDataFrame.from_features(aoi)
    centroid = gdf.geometry.centroid[0].y, gdf.geometry.centroid[0].x

    return centroid


def choose_variables():
    base_df = get_data("table_water_extent")
    print(base_df)
    with st.sidebar:
        st.sidebar.markdown("### Select date and indicator")
        date = st.selectbox("Date", base_df.index)
        variable = st.selectbox("Indicator", ["Water extent"])
        analytics_file = "table_water_extent"
        df = get_data(analytics_file)
        # Drop unused columns from Water extent table
        if variable == "Water extent":
            df = df[["Water [Has]", "Not Water [Has]", "Percentage [%]"]]
    return date, variable, df

st.set_page_config(page_title="Water quality monitoring Pulse", page_icon="💧")

centroid = get_aoi_centroid()

date, variable, dataframe = choose_variables()

# Create map with Folium
m = folium.Map(
    location=centroid,
    zoom_start=12,
    tiles="CartoDB Positron",
)
# Add the analytic layer to the map
raster = folium.raster_layers.TileLayer(
    tiles=f"{XYZ_URL}/median_water_mask_{date}.tif/{{z}}/{{x}}/{{y}}.png?palette=Blues&stretch=0,1",
    attr="Water Quality Pulse",
    name="Water",
    overlay=True,
    control=True,
    show=True,
)
raster.add_to(m)
folium_static(m)

st.title("Water quality Analytics")
st.line_chart(dataframe, color=["#D80707", "#01438E", "#00D4FF"])
if st.checkbox("Show data"):
    st.write(dataframe)
Running and deploying the project
We’re almost at the end! Now that we have our project ready to be executed, let’s deploy it without further delay! To do this, and as we have already seen, we are going to return to the CLI.
Running locally
To run our project locally, and given that we already have all the environment variables defined, we are simply going to execute the following command:
spai run -iAs processes are executed you will see messages in the CLI. If everything works as expected, you should have your very own water quality monitoring service running locally! Let’s check out our newly executed service by going to the localhost:8501.
Thus, we can visualize the water mask on a webmap.
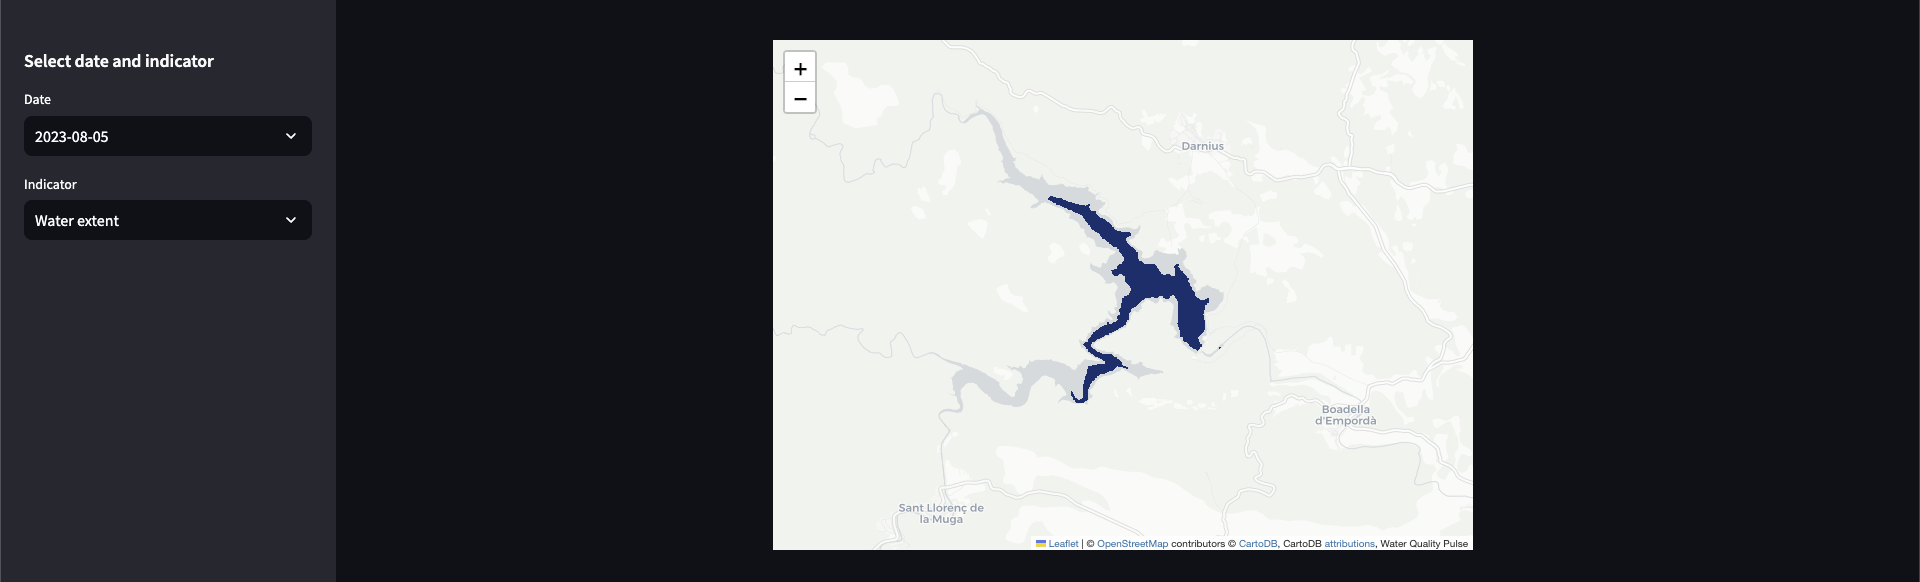
And the time series analytics, although in this case it is only 2 days for the demonstration.
Deploy on the cloud
Now we have run it locally, but what if we deploy it in the cloud? Let’s do it!
spai deployBut before, make sure you make the following two changes:
- Change the
typeof the storage inspai.config.yamltos3, so your data is stored in a cloud bucket. - Change the command for the ui to
streamlit run main.py --server.address 0.0.0.0 --server.port 80, this is due to how streamlit works.
Remember to authenticate if you have not.
spai auth login
After running the deploy command, you will get a URL to your dashboard where you can track the status of the water quality project.
Once the process is finished… it will be deployed! Hooray!
Isn’t it incredible? We have the project we have developed deployed in the cloud, and anyone can access it!
Share the project with your friends! Let them come in and see what you’ve been able to do with SPAI!
What’s next?
Congratulations! You have created a project from scratch to monitor water bodies, and not only have you developed it but you have also deployed it to the cloud, with hardly any effort. Remember that the water_quality function from SPAI will compute many more layers and analytics, so we challenge you to upgrade this project to display all of them. Check the reference to know more.
This is just the beginning, we have just scratched the surface of what you can do with SPAI, but from here you will have to discover it yourself. We encourage you to start creating your projects and templates, and explore what can be done with SPAI. The opportunities are endless!
If you prefer to dig deeper into the platform, you can check the reference section to learn more about the different components of the platform, including the CLI and the Python library to build your own applications.
Back to topJoin our Discord to be part of the community, get in touch with other developers and be part in shaping the future of Earth Observation 🛰️